
Human Terrain
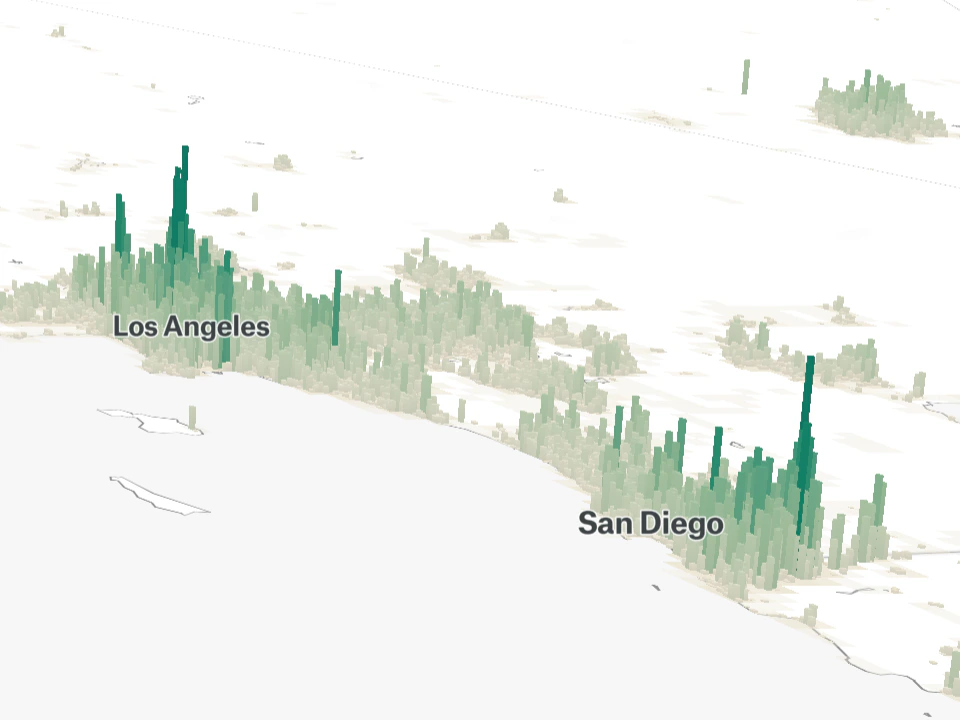
Compare cities around the world using rich data visualizations that represent population, density and scale.
The Long View
Most of our experiences are measured in days, months, or years. Cities operate on longer timelines. The forces that shape them accumulate gradually, often becoming visible only when viewed across decades. Step back far enough and patterns begin to emerge. Growth, decline, migration, and change leave their marks on the landscape, revealing a story that is difficult to see from the ground.
People and organizations
More to Explore
Reveal the hidden rhythms of Manhattan through layers of population data.
Tokyo Trains is an interactive visualization of Tokyo’s railway network with time playback, date selection, camera navigation, line filtering, and station-complex focus. It presents the network as an approximate sketch, combining published timetable service with clearly distinguished synthetic schedules where published times are unavailable.
Explore a snapshot of the web from 2011 as a vast galaxy of interconnected websites.